The Hidden Language of Research: Citations, H-Index, Impact Factor & Journal Rankings
· ORBIXER AI LABS
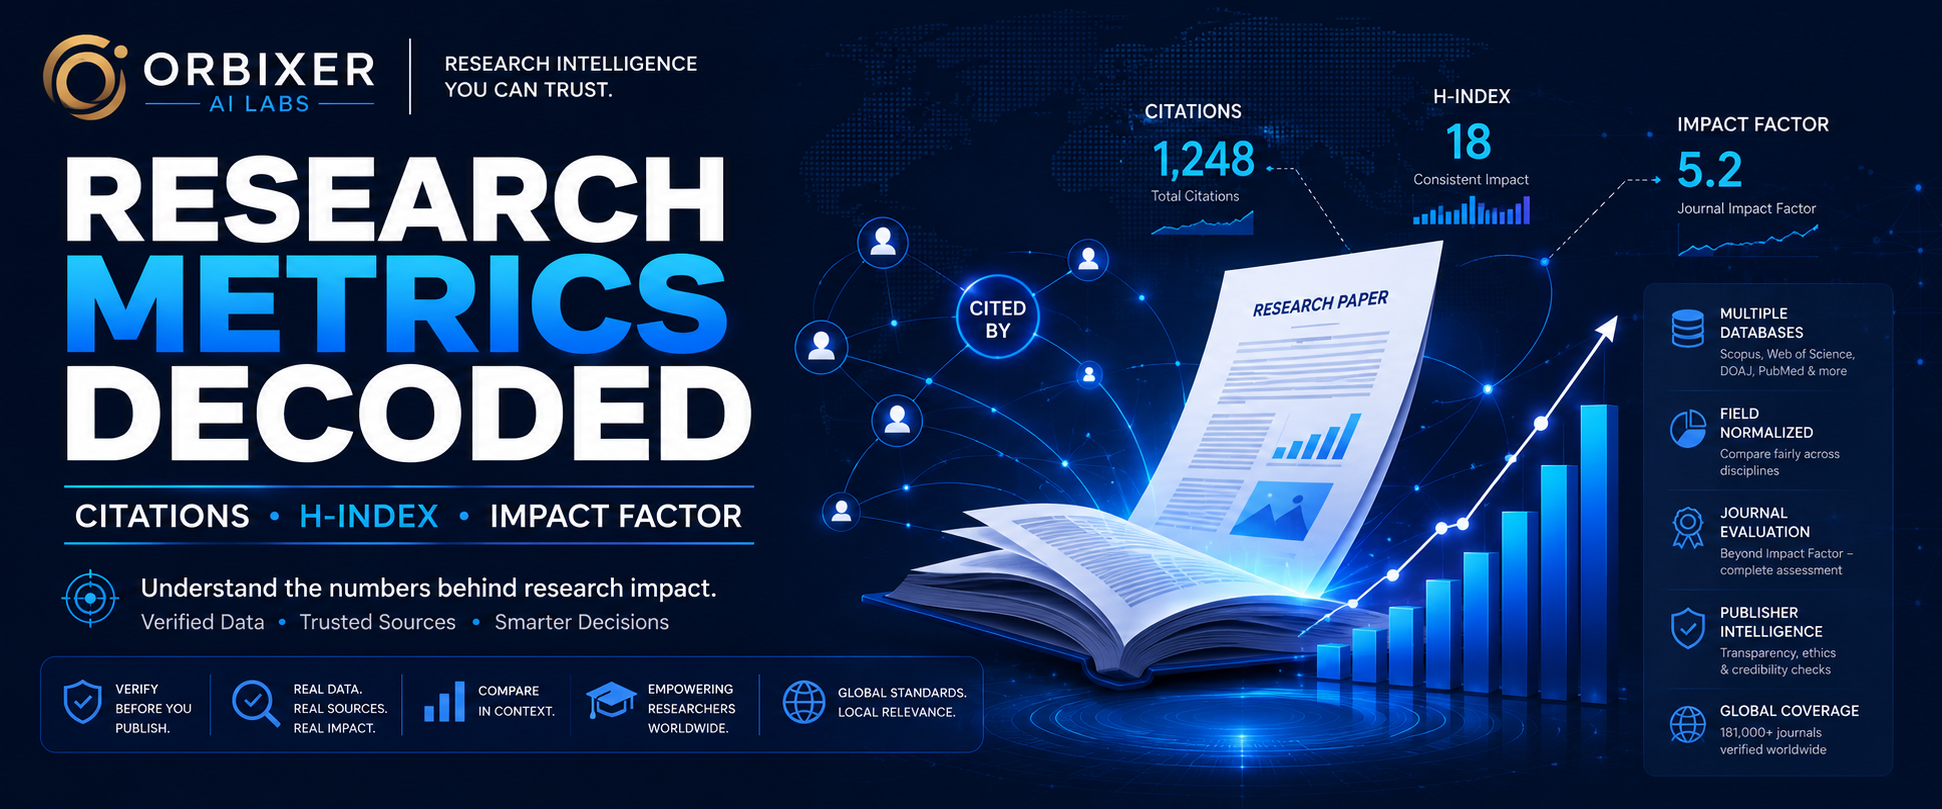
ORBIXER RESEARCH INTELLIGENCE
Understanding Research Metrics
A Complete, Plain-Language Guide to Impact Factor, H-Index, Citations, Journal Scores, Researcher Scores and Publisher Evaluation
Who this guide is for: PhD scholars, faculty, IQAC Directors, Research Deans and anyone who reads a journal metric and needs to know exactly what it means, who calculated it, and how far to trust it. |
Core principle: No single metric can completely measure research quality. A good research evaluation system combines quantitative indicators with expert judgment, peer review and qualitative assessment.
Part I — The Building Blocks: Citations
1. What Is a Citation?
A citation is a formal reference made by one scholarly work to another scholarly work. In simple terms:
Research Paper A → used, discussed or referenced by another work → Citation |
Worked Example
EXAMPLE Dr. A publishes a paper in 2022: “Effect of Vitamin D Deficiency on Pre-eclampsia.” Over the next few years, 25 other papers refer to this study in their reference lists. Result → the paper has 25 citations. |
If Paper B writes “The findings are consistent with those reported by Mishra et al.” and formally references Paper A in its bibliography, Paper A receives one citation. If 100 different papers cite Paper A, total citations = 100.
Why Citations Matter
A paper may be cited because another researcher:
Uses its methodology
Builds upon its findings
Supports its conclusions
Criticizes its conclusions
Compares results against it
Uses its dataset
Reviews it in a systematic review or meta-analysis
CAUTION A citation indicates scholarly acknowledgement or use. It does not automatically mean the cited paper is correct, high quality or universally accepted. A paper can be cited heavily because its findings are controversial or because other researchers are debating its limitations. |
2. What Is Citation Count?
Citation Count is the total number of times a publication has been cited by other indexed publications — within a particular database. The same paper will show different numbers in different databases, because each database has different source coverage, different journal/conference/book coverage, and different methods of identifying citing documents.
Worked Example
Database | Citations |
Web of Science | 40 |
Scopus | 52 |
Google Scholar | 81 |
RULE Citation numbers must always be reported together with their source database — e.g. “52 citations according to Scopus”, not a bare number. These figures are not interchangeable. |
3. Total Citation Count for a Researcher
A researcher's total citation count is the sum of citations received by every indexed publication of theirs.
Total Citations = C₁ + C₂ + C₃ + … + Cₙ Where Cᵢ = citations received by publication i, and n = total number of publications |
Paper | Citations |
Paper 1 | 100 |
Paper 2 | 60 |
Paper 3 | 25 |
Paper 4 | 10 |
Paper 5 | 5 |
Total Citations = 100 + 60 + 25 + 10 + 5 = 200
LIMITATION Total citations alone don't describe a full research profile. One researcher may have a single blockbuster paper and many weak ones; another may have modest but consistent citations across many papers. Both can show similar totals. This gap is exactly why the H-index was created. |
Part II — Researcher-Level Metrics
4. What Is the H-Index?
The H-index is the best-known metric for a researcher's combined productivity and citation impact. Proposed by physicist Jorge E. Hirsch in 2005, it answers two questions at once: how many papers has the researcher produced, and how consistently have those papers been cited?
Formal Definition
A researcher has an H-index of h when h of their papers have each received at least h citations. |
h = max { h : Cₕ ≥ h } |
Worked Example — 10 Papers
Paper Rank | Citations | Citations ≥ Rank? |
1 | 100 | Yes |
2 | 80 | Yes |
3 | 45 | Yes |
4 | 30 | Yes |
5 | 20 | Yes |
6 | 12 | Yes |
7 | 8 | Yes |
8 | 6 | No |
RESULT The researcher has 7 papers with at least 7 citations each, but not 8 papers with at least 8 citations each. H-index = 7 |
The Counter-Intuitive Case
Paper | Citations |
1 | 10,000 |
2 | 2 |
3 | 1 |
4 | 0 |
Despite one blockbuster paper with 10,000 citations, only two papers have at least 2 citations each. H-index = 2.
PHILOSOPHY One highly cited paper alone cannot produce a very high H-index. Consistent citation performance across multiple publications is required. |
5. How Should the H-Index Be Interpreted?
There is no universal H-index that defines a “good researcher.” An H-index of 10 may be excellent in one field and modest in another, because citation behaviour differs enormously by discipline:
Medicine — large research communities, high citation activity
Physics — large collaborative papers with many co-authors
Mathematics — slower citation accumulation
Humanities — fewer citations, longer publication cycles
Computer Science — relies heavily on conference publications
Engineering — citation patterns differ from biomedical research
RULE OF FAIR COMPARISON Researchers should be compared only against peers at a similar career stage, in the same or closely related field. Comparing a senior oncology professor's H-index with a young Sanskrit-studies researcher is scientifically inappropriate. |
6. Database-Specific H-Index
Database | H-index |
Scopus | 18 |
Web of Science | 16 |
Google Scholar | 24 |
The correct way to state this is “H-index: 18 according to Scopus” — never a bare, unsourced number.
7. What Is the i10-Index?
The i10-index is a Google Scholar metric: the number of publications that have received at least 10 citations each.
i10 = number of papers where citations ≥ 10 |
Example: a researcher with 15 papers each having ≥ 10 citations has an i10-index of 15.
8. What Is the G-Index?
The G-index gives more weight to highly cited papers than the H-index does. A researcher has G-index g when their top g publications have collectively received at least g² citations.
Worked Example
Top 4 papers received: 100, 40, 20 and 10 citations. Total = 170.
g² = 4² = 16 → 170 ≥ 16, so G-index qualifies at g = 4 |
The G-index rewards a single highly influential paper more strongly than the H-index does.
9. What Is the M-Index?
The M-index corrects for career length — senior researchers naturally accumulate more citations simply by having more years to publish.
M = H / Y H = H-index, Y = years since first publication |
Researcher | H-index | Career Length | M-index |
Researcher A | 20 | 20 years | 20/20 = 1.0 |
Researcher B | 10 | 5 years | 10/5 = 2.0 |
Researcher A has the higher H-index, but Researcher B has accumulated citation impact faster.
Part III — Journal-Level Metrics
10. What Is the Journal Impact Factor (JIF)?
The Journal Impact Factor, or JIF, is a journal-level citation metric from Clarivate's Journal Citation Reports (JCR).
MOST IMPORTANT POINT Impact Factor belongs to the journal. It does not belong to an individual researcher or an individual research paper. Clarivate itself cautions against using JIF as a measure of an individual article, researcher or institution. |
Impact Factor Formula
JIF = (Citations this year to items published in the previous 2 years) ÷ (Number of citable items published in those 2 years) |
Worked Example
EXAMPLE Year 1 citable items: 100. Year 2 citable items: 150. Total = 250. Citations received to these items in the calculation year: 1,250. JIF = 1250 ÷ 250 = 5.0 |
This does not mean every paper in the journal gets exactly 5 citations. Citation distribution is usually very uneven — one paper may get 500, another 50, another 0. The journal-level average does not describe every individual paper.
Who Actually Gives the Impact Factor?
A legitimate Journal Impact Factor is tied to Clarivate's JCR and the underlying Web of Science Core Collection coverage. Be careful of sites or journals claiming:
Global Impact Factor
Universal Impact Factor
Scientific Impact Factor
Cosmos Impact Factor
International Impact Factor
THE RIGHT QUESTION A name containing the words “impact factor” does not make it the official metric used in JCR. Always ask: Which organization calculates this, what database is used, and is the methodology transparent and independently verifiable? |
11. What Is CiteScore?
A CiteScore is a source-level citation metric based on Scopus data, covering journals, book series, conference proceedings and other eligible serial titles. It uses a four-year citation window.
CiteScore = (Citations received over 4 years) ÷ (Eligible documents published over the same 4 years) |
EXAMPLE Eligible indexed documents over 4 years: 800. Citations to those documents: 4,000. CiteScore = 4000 ÷ 800 = 5.0 |
CiteScore is a Scopus-based metric and must never be confused with the (Clarivate) Journal Impact Factor.
Impact Factor vs. CiteScore — Side by Side
Feature | Journal Impact Factor | CiteScore |
Main provider | Clarivate | Scopus / Elsevier |
Database basis | Web of Science / JCR | Scopus |
Main level | Journal | Serial source |
Citation window | JIF methodology | 4-year window |
Measures a researcher? | No | No |
Measures a single paper? | No | No |
12. What Is SJR (SCImago Journal Rank)?
SJR attempts to measure the scientific prestige of a source. Not all citations are treated equally — a citation from a highly influential source contributes differently than one from a less influential source. Scopus describes SJR as prestige-weighted, factoring in the subject field, quality and reputation of the citing journal.
SJR ≠ Total Citations ÷ Total Papers SJR uses a prestige-weighted citation network, not a simple average. |
13. What Is SNIP (Source Normalized Impact per Paper)?
SNIP adjusts citation impact for differences in citation behaviour across fields — e.g. molecular biology generates far more citations than mathematics for reasons unrelated to quality. SNIP provides a more context-sensitive, field-aware measure.
14. What Is a Journal Quartile?
Journals are classified into quartiles (Q1–Q4) representing relative position within a subject category:
Quartile | Approximate Position |
Q1 | Top 25% |
Q2 | 25%–50% |
Q3 | 50%–75% |
Q4 | Bottom 25% |
THE CRITICAL PHRASE Quartile is always within a particular subject category. A journal can be Q1 in Category A and Q2 in Category B at the same time. Saying “this is a Q1 journal” is incomplete — say instead: “Q1 in [subject category], according to [metric/database/year].” |
15. What Is Percentile?
Percentile shows relative position within a subject category. A CiteScore Percentile of 96 means the journal ranks as high as or higher than roughly 96% of sources in that category — approximately the top 4%.
Part IV — Four Different Levels of Evaluation
This is the single most important distinction for anyone reading a metric: a number always belongs to one of four levels — the paper, the researcher, the journal, or the publisher. Mixing them up is where most misunderstandings about “impact” come from.
16. A. Paper-Level Metrics
Citation count
Citations per year
Field-normalized citation indicators
Usage / attention indicators
Reference and citation context
17. B. Researcher-Level Metrics
Total publications
Total citations
H-index, i10-index, G-index, M-index
Citations per paper
Career-stage adjusted metrics
18. C. Journal-Level Metrics
Journal Impact Factor
CiteScore
SJR
SNIP
Category rank, percentile, quartile
19. D. Publisher-Level Evaluation
A publisher cannot be represented by one journal's metric. A responsible evaluation examines:
Portfolio Quality
Which journals does the publisher manage?
Which databases index those journals?
What are the journals' citation profiles?
Editorial Transparency
Editorial board information
Editor identities and institutional affiliations
Contact transparency
Peer-Review Policies
Clearly described peer-review process
Publication ethics
Retraction and correction procedures
Publishing Standards
DOI infrastructure
ISSN verification
Archiving policies
Licensing information and APC transparency
Indexing Claims
A publisher should not merely display database logos. A claim like “Indexed in Scopus” should be independently checked against the actual source database.
ORBIXER'S CORE VALUE Verify the claim, verify the source, verify before you publish. |
Part V — Productivity, Averages and Field Normalization
20. What Is Research Productivity?
Productivity refers to the quantity of scholarly output — papers, reviews, books, book chapters, conference papers, datasets, patents and other recognized outputs. Productivity is not the same as impact:
Researcher | Papers | Citations |
Researcher A | 100 | 200 |
Researcher B | 20 | 5,000 |
There is no single correct answer to “who is better” from these two numbers alone — A has higher volume, B has higher impact. A complete assessment needs context.
21. What Is Citations Per Paper?
Average Citations per Paper = Total Citations ÷ Total Publications |
Example: 1,000 citations ÷ 50 publications = 20 citations per paper.
CAUTION Averages can be distorted by one blockbuster paper. Interpret this figure alongside H-index, citation distribution, median citations and field normalization. |
22. What Is Field-Normalized Citation Impact?
Different fields cite at very different rates, so 100 citations means different things in different fields. Field normalization compares a paper's actual citations against the expected citation level for comparable publications (same field, year, document type).
Normalized Citation Impact = Actual Citations ÷ Expected Citations for Comparable Publications |
EXAMPLE A paper receives 30 citations. Comparable papers (same field, year, document type) average 15 citations. 30 ÷ 15 = 2.0 → the paper performs at roughly 2× the expected citation level. |
23. What Does “Highly Cited” Mean?
There is no single citation number that universally defines “highly cited.” 100 citations in a narrow field may be extremely influential; 100 citations in a very large, active field may be unremarkable. “Highly cited” status should be judged relative to subject field, publication year, document type, database and comparison methodology.
KEY IDEA Impact is relative to context. |
24. What Is Altmetrics?
Traditional citations take time to accumulate. Altmetrics capture attention from other sources: news coverage, policy documents, social media, blogs, online reference managers and public discussion.
CAUTION Attention is not the same as scientific quality. A paper can get major public attention without strong scientific influence, and a highly influential paper may get little social-media attention. Altmetrics should complement, never replace, scholarly evaluation. |
25. What Is Peer Review?
Before any citation metric becomes relevant, the manuscript passes through peer review — experts assessing the research question, novelty, study design, methodology, statistics, ethics, interpretation, references, limitations, reproducibility and writing quality.
REMEMBER A citation score does not replace peer review. A highly cited paper can still have methodological limitations, controversial conclusions, later corrections, or even retractions. Citation impact and scientific validity are related but not identical. |
Part VI — Putting It All Together: How to Judge a Journal
26. Who Decides Whether a Journal Is “Good”?
No single global organization simply labels every journal “good” or “bad.” Different databases and organizations evaluate journals against their own criteria:
Indexing — is it included in recognized scholarly databases?
Editorial quality — named editors, qualified editorial board, transparent affiliations
Peer review — clearly described process, appropriate timelines, ethical policies
Publishing infrastructure — ISSN, DOI, archiving, metadata quality
Citation performance — JIF, CiteScore, SJR, SNIP and other indicators
Publication ethics — retraction policy, correction policy, conflict-of-interest policy, plagiarism policy
Transparency — clear publication charges, contact information, publisher identity
27. Three Different Questions Every Researcher Should Ask
Question 1 — Is this journal legitimate?
Requires: identity verification, publisher verification, website verification, editorial transparency, policy verification, indexing verification.
Question 2 — How influential is this journal?
Requires: Journal Impact Factor, CiteScore, SJR, SNIP, percentile, quartile, citation performance.
Question 3 — Is this journal suitable for my paper?
Requires: subject scope, article-type acceptance, indexing requirements, publication charges, open-access model, review process, timelines, and ethical/institutional requirements.
THE RULE A journal can be legitimate but low-impact, high-impact but unsuitable for a specific manuscript, or indexed but not right for the author's requirements. Verification, impact and suitability are three separate questions — never treat them as one. |
28. The Five-Layer Evaluation Model
Layer 1 — Identity Verification
Journal title, ISSN/eISSN, publisher, website, DOI prefix, country and publishing entity (where verifiable).
Layer 2 — Indexing Verification
Check the journal is actually listed in Scopus, Web of Science, PubMed, DOAJ, Embase and relevant subject databases. The result should read as one of:
Status | Meaning |
Verified | Confirmed present in the source database |
Not Found | Checked, and not present |
Not Applicable | Database does not apply to this domain |
Unable to Verify | Insufficient evidence either way — never treated as a pass |
Layer 3 — Journal Metrics
Display each metric separately and labelled by source — never merge different systems into one unexplained score:
Web of Science / JCR — Journal Impact Factor, category, rank
Scopus — CiteScore, CiteScore Percentile, CiteScore Rank, CiteScore Quartile, SJR, SNIP
Layer 4 — Researcher Metrics
Total publications, total citations, H-index, i10-index, citations per paper, publication timeline, citation trend, highly cited publications — each carrying its source label, e.g. “H-index: 12 — Scopus,” never a bare number.
Layer 5 — Publisher Intelligence
Transparency, journal portfolio, technical infrastructure, publishing policies, and risk signals (indexing-claim mismatch, suspicious metric claims, missing editorial information, false database logos, unverifiable addresses, unrealistic publication promises).
THE GOAL Verified evidence + transparent signals + unresolved concerns — never an automatic “predatory” label without evidence. This is scientifically safer and more defensible. |
29. The Most Important Warning About Any Metric
A metric is only meaningful once seven things are known:
What exactly is being measured?
At what level is it measured — paper, researcher, journal or publisher?
Which database provides the data?
What is the calculation method?
What time period is used?
Which subject field is involved?
What are the limitations?
Incomplete Statement | Correct Statement |
Impact Factor = 5 | Journal Impact Factor for [journal], [year], per Clarivate JCR |
H-index = 20 | H-index of 20 according to Scopus, based on publications and citations indexed in Scopus at time of assessment |
The ORBIXER Conclusion
Research cannot be reduced to one number.
A citation measures one form of scholarly acknowledgement.
The H-index combines productivity with sustained citation performance.
The Journal Impact Factor is a journal-level indicator — never a score for an individual researcher or article.
CiteScore measures citation impact for eligible sources using Scopus data over a four-year window.
SJR introduces citation prestige. SNIP adjusts for field-level citation behaviour.
Quartiles and percentiles provide relative context within subject categories.
The strongest evaluation always asks:
Is the research authentic? Is the journal verified? What exactly does this metric measure? Who calculated it? Which database produced the result? How does the result compare within the correct field and context? |
VERIFY THE JOURNAL. UNDERSTAND THE METRIC. COMPARE IN CONTEXT. EVALUATE RESPONSIBLY.
VERIFY BEFORE YOU PUBLISH.
orbixer.in